Monday, 9 June 2025

CDSS module for EHRs based on FMEA (failure mode and effects analysis) of clinical guidelines

Disclaimer:- written with help of ChatGPT. 

FMEA = Failure Mode and Effects Analysis

EHR (Electronic Health Record) system that integrates FMEA insights to ensure safer, guideline-adherent patient centered asthma care. 


Here's how:


*1. Embed Clinical Decision Support (CDS):*

- Prompt doctors to *prescribe ICS* when asthma severity meets criteria.

- Alert if dose is too low/high for age/severity.

- Remind providers to *schedule follow-ups*.


*2. Workflow Checklists:*

- Use structured forms to *ensure inhaler technique is taught*.

- Include mandatory fields for *trigger assessment & avoidance advice*.


*3. Automation & Reminders:*

- Auto-generate *follow-up appointments*.

- Send *educational materials* to patients via portal.


*4. Real-Time Error Prevention:*

- Prevent prescription submission if *key steps* (e.g., patient education, dose confirmation) are skipped.

- Use color-coded *risk indicators*.


*5. Analytics Dashboard:*

- Track compliance with asthma guidelines.

- Monitor for *frequent deviations* or errors.


Such an EHR would directly address the failure modes identified in your FMEA and improve both safety and outcomes. 


Prompt - FMEA analysis of a clinical guideline for asthma

ChatGPT -

Here's an FMEA (Failure Modes and Effects Analysis) of a clinical guideline for asthma management, particularly focusing on key components like diagnosis, treatment, patient education, and follow-up. This helps identify potential failure points that could harm patient outcomes or healthcare processes.


FMEA for Clinical Guideline: Asthma Management

Step Potential Failure Mode Potential Effects of Failure Potential Causes Current Controls Severity (S) Occurrence (O) Detection (D) RPN (S×O×D) Recommended Action
1. Diagnosis of asthma Misdiagnosis (e.g., COPD mistaken for asthma) Inappropriate treatment, poor control, adverse effects Inadequate history, no spirometry Clinical training, spirometry guideline 9 5 4 180 Mandatory spirometry for diagnosis; provider training
2. Severity classification Underestimating severity Inadequate therapy, frequent exacerbations Poor symptom documentation, rushed consult GINA severity criteria 8 4 3 96 Use checklists; digital decision support tools
3. Prescribing controller meds Omission or incorrect dosage of inhaled corticosteroids (ICS) Poor control, ER visits, exacerbation Lack of knowledge, misinterpretation of stepwise therapy Pharmacy check, EHR alerts 9 3 3 81 Incorporate guideline-based alerts in EMRs
4. Patient education Inadequate inhaler technique education Poor drug delivery, ineffective treatment Time constraints, staff not trained Nurse education, pamphlets 7 6 5 210 Hands-on demo + teach-back method; audit technique regularly
5. Follow-up planning Missed or delayed follow-up Poor long-term control, risk of severe attacks Poor tracking, patient noncompliance Appointment system 7 4 5 140 SMS reminders, follow-up flag in EMR
6. Emergency care plan No written action plan for acute exacerbations Delayed response in emergencies, hospitalization Clinician oversight, lack of time Verbal advice given 8 5 4 160 Mandate written action plans at diagnosis
7. Allergen/environmental control Failure to advise on trigger avoidance Continued exposure, symptom worsening Lack of awareness, not assessed Patient interview 6 4 4 96 Standard environmental history checklist

Key

  • Severity (S): Impact of failure (1 = low, 10 = catastrophic)

  • Occurrence (O): Likelihood of failure (1 = rare, 10 = frequent)

  • Detection (D): Likelihood that failure is detected before harm (1 = very likely, 10 = not likely)

  • RPN (Risk Priority Number): S × O × D


Top Priority Areas Based on RPN

  1. Inhaler technique education (RPN 210)

  2. Diagnosis without spirometry (RPN 180)

  3. Lack of emergency action plan (RPN 160)


Let me know if you'd like this tailored to a specific setting (e.g., rural India, pediatric care, emergency departments), or if you want it as a PowerPoint/table PDF.


Friday, 13 September 2024

Doctor's Moat Over Time, While Saving Lives

My town.


1960 - Local Vaidhya

- Moat: The only available healer within a 20 km radius.  

- Insight: Exclusivity based on access and trust in traditional knowledge.


1980 - First College-Educated Doctor (BAMS)  

- Moat: Higher education credentials in Ayurveda, standing out as the first formally trained doctor in town.  

- Insight: Early adopters of formal education create a new level of trust.


1980s - Public Health Center (PHC)

- Moat: Government-provided healthcare with free services.  

- Insight: Accessibility to formal care is democratized, but only for basic treatments.


1990 - Occasional Visiting MBBS Doctor

- Moat: Limited competition, as visiting MBBS doctors are rare in small towns.  

- Insight: Scarcity of modern medicine professionals retains exclusivity.


2000 - Local Mix of Doctors (BAMS, BHMS, MBBS)

- Moat: Relationships and trust-building become critical as the number of local doctors grows.  

- Insight: Personal connections with patients ensure loyalty amid growing competition.


2010 - Introduction of Specialists

- Moat: Specialized care draws patients to cities with an increasing density of clinics offering niche treatments.  

- Insight: Specialization and centralization begin to take hold, shifting focus away from generalists.


2020 - Patient Shift to City Centers

- Moat: Marketing, celebrity status, and referral commissions differentiate successful doctors in competitive urban environments.  

- Insight: Patients opt for expertise over convenience, even battling to get appointments.


2025 - Arrival of Large Corporate Hospital Franchises 

- Moat: Comprehensive care under one roof with standardized quality and reputation.  

- Insight: Corporate setups cater to the patient’s need for assurance, convenience, and variety in one place.


2030 - Corporate Competition Intensifies

- Moat: Modular, process-based setups emphasize efficiency, insurance funding, marketing, and referral networks.  

- Insight: Patient interaction with the system rather than specific doctors; process consistency becomes key.


2035 - AI and Automation in Healthcare  

- Moat: Cost-cutting and speed via automation ensure higher patient flow without compromising care quality. Patients who desire more human interaction pay a premium for personal expertise.  

- Insight: The system becomes highly efficient, but personalized care turns into a luxury, available only at a higher cost.


2040 - The Future of Healthcare


Let see how it develops in coming years

Sunday, 8 September 2024

Just another LLM analytics but for our highly complex case of a rare unidentified illness.

 Keywords

- Clinical complexity

- Undiagnosed illness

- Slow medicine

- Narrative History


Access detailed case record here - https://classworkdecjan.blogspot.com/2019/05/42-f-with-severe-regular-edema-with_17.html


Summary of analysis

Giving my opinion as scoring for performance of ChatGPT along with consideration of bias (limitation) that it have to reply in just a few short paragraphs.


Thematic analysis - 3/5

Critical analysis - 3/5

Research questions - 2/5


Subjective ratings, cutting marks for 

- losing themes of emotional pain

- critical analysis no evidence/ insights about any interventions

- no new Research questions other than what's directly noticeable in text.


Giving marks for

- good summary and prioritization of themes.

- covering wide range of important aspects in critical analsys.

- able to formulate research questions that are prioritized in text.


Usability -

- For usefulness to get clinical understanding/outline quickly - 4/5.

- For usefulness to get actionable (preferably evidence backed) insight - 1/5

Weakness - brute force strategy of summarizing literature, but no individualized exploration.


For speed - 100/5 🤣

Sunday, 7 July 2024

Cbble/pajr/udhc model targets

Avinash - What will be this called in management/MBA terms?


1) Listing all key stakeholders in an industry


2) then listing top 5-10 problems they face


3) then Plotting the interconnections with common gaps


Eg. Money, man, machine


4) finally Plotting an interconnection of resource sharing?


Eg. Unskilled MBBS degree holders joining electives to become high skilled care provider.


Avinash - Like amazon does resource optimization to enable end user to get best, fastest and cheapest while also enabling sellers.

Although two side effects are

- small sellers who don't upgrade to better business goes towards eradication 

- those on top gets too much power and control


(Both are like survival of fittest on game of life /evolution)


Avinash- Lack of availability of this training is a gap


Lack of demand may also be a gap


Connecting pain points may give directions to fill the gaps.


Avinash - A diagram like this may be very interesting


Covn.org


(this covenant project was one of a few that i tried during covid)

Avinash- Many startups are coming in healthcare that do these connection of resources.

Avinash- Found answer from chat gpt, its


*Stakeholder Analysis and Resource Mapping.*

Avinash- Wow..chatgpt did a very good effort to give direction.. answer copied below 

Certainly! Here’s a high-level Stakeholder Analysis and Resource Mapping for healthcare in India:


### 1. Stakeholder Identification


**Key Stakeholders in Indian Healthcare:**

- **Patients**: General public, rural and urban populations, specific patient groups (e.g., chronic disease sufferers).

- **Healthcare Providers**: Doctors, nurses, paramedics, and other healthcare professionals.

- **Healthcare Institutions**: Hospitals (public and private), clinics, primary health centers.

- **Government Agencies**: Ministry of Health and Family Welfare, state health departments, regulatory bodies (e.g., Medical Council of India).

- **Pharmaceutical Companies**: Manufacturers, distributors, and retailers of medicines and medical supplies.

- **Medical Device Manufacturers**: Producers of medical equipment and technology.

- **Insurance Companies**: Public and private health insurers.

- **Non-Governmental Organizations (NGOs)**: Organizations working in healthcare awareness, patient support, and public health initiatives.

- **Educational Institutions**: Medical colleges, nursing schools, and training institutes.

- **Technology Companies**: Providers of healthcare IT solutions, telemedicine services, and health data analytics.


### 2. Stakeholder Needs and Issues Assessment


**Top Problems Faced by Stakeholders:**

- **Patients**: Accessibility to quality healthcare, affordability, awareness of health issues, and waiting times.

- **Healthcare Providers**: Workload and burnout, inadequate infrastructure, lack of continuous professional development, and compensation issues.

- **Healthcare Institutions**: Funding, staffing shortages, outdated technology, and administrative inefficiencies.

- **Government Agencies**: Policy implementation challenges, corruption, resource allocation, and monitoring healthcare quality.

- **Pharmaceutical Companies**: Regulatory hurdles, counterfeit drugs, supply chain issues, and R&D costs.

- **Medical Device Manufacturers**: Market penetration, regulatory compliance, and technological advancement.

- **Insurance Companies**: Fraudulent claims, customer education, and regulatory changes.

- **NGOs**: Funding, scalability of initiatives, and collaboration with government and private sector.

- **Educational Institutions**: Quality of education, updating curriculum, and bridging theory-practice gap.

- **Technology Companies**: Adoption of technology, integration with existing systems, and data privacy concerns.


### 3. Gap Analysis and Interconnection Mapping


**Common Gaps and Interconnections:**

- **Funding**: Shortage of funds for hospitals, research, and public health initiatives. Potential for public-private partnerships.

- **Manpower**: Shortage of trained medical professionals. Collaboration between educational institutions and healthcare providers for better training.

- **Infrastructure**: Outdated or insufficient healthcare infrastructure. Technology companies can provide innovative solutions.

- **Accessibility**: Rural populations face significant barriers. NGOs and government programs can work together to improve reach.

- **Regulation**: Complex regulatory environment. Streamlining processes could help pharmaceutical and medical device companies.

- **Awareness**: Lack of health awareness among the population. Educational initiatives by NGOs, government, and private sector can bridge this gap.


### 4. Resource Sharing and Collaboration Mapping


**Examples of Resource Sharing:**

- **Medical Training**: Partnerships between educational institutions and healthcare providers to enhance the skills of medical graduates. For example, unskilled MBBS degree holders can join electives and residencies to become high-skilled care providers.

- **Technology Integration**: Collaborations between technology companies and hospitals to implement electronic health records (EHRs), telemedicine, and health data analytics.

- **Public-Private Partnerships**: Joint ventures to build and upgrade healthcare infrastructure, especially in rural areas.

- **Pharmaceutical Collaboration**: Joint R&D initiatives between pharmaceutical companies and academic institutions to develop new treatments.

- **NGO and Government Collaboration**: NGOs can assist in implementing government health programs, increasing reach and effectiveness.


### Visualization


Creating detailed maps and diagrams to visualize the stakeholder interconnections and resource sharing can help in understanding the complex relationships and identifying areas for improvement. Tools such as stakeholder maps, gap analysis charts, and resource flow diagrams can be useful for this purpose.


By performing this comprehensive analysis, stakeholders can better understand their roles, the challenges they face, and the opportunities for collaboration and resource optimization in the Indian healthcare sector.


Dr. Rb - 👏👏

Archive this entire thing beginning from your question at 11:03 till the LLM response at 11:27

and share the link so that we can cite it in our own write up

Thursday, 2 May 2024

29m quantified self pajr - 3

 1) [28/04, 7:43 pm] Dr.Dinesh Datta: Check out concept of SDA(Specific Dynamic Action)

[28/04, 7:50 pm] Dr. Avinash Kumar Gupta: Specific dynamic action (SDA), also known as the thermic effect of food (TEF), refers to the energy expenditure associated with the digestion, absorption, and metabolism of food. Essentially, it's the energy your body uses to process the food you eat. Different macronutrients have different SDA rates. For example, protein has a higher SDA compared to fats or carbohydrates. This means that your body burns more calories digesting and metabolizing protein compared to other nutrients.

[28/04, 7:50 pm] Dr. Avinash Kumar Gupta: How clinician can use this info for this case?

[28/04, 8:02 pm] Dr.Dinesh Datta: Basically..

BMR is the energy your body needs to function at rest.SDA(aka thermic effect/dietary induced thermogenesis) is extra energy your body burns to process food.It covers digestion,absorption and storage of nutrients from what you eat.Proteins have high SDA,requiring more energy to process compared to carbs and fats.

Sda is another layer over BMR in understanding total energy expenditure in body.


Total energy expenditure is BMR+SDA+Activity level


Basically we say,bmr is engine size of your metabolism and sda is fuel efficiency.


By understanding TEE,we can tailor/better understand weight gain/loss

[28/04, 8:03 pm] Dr. Avinash Kumar Gupta: Useful


2) To calculate your Basal Metabolic Rate (BMR), we can use the Harris-Benedict equation. 


For males:

BMR = 88.362 + (13.397 × weight in kg) + (4.799 × height in cm) - (5.677 × age in years)


First, we convert your height to centimeters:

5 feet 5 inches = 165.1 cm (1 foot = 30.48 cm, 1 inch = 2.54 cm)


Now, plug in the values:

BMR = 88.362 + (13.397 × 81.5) + (4.799 × 165.1) - (5.677 × 30)


BMR ≈ 88.362 + 1093.955 + 791.334 - 170.731

BMR ≈ 1803.92 calories per day


So, your Basal Metabolic Rate (BMR) is approximately 1803.92 calories per day. This is the number of calories your body needs to maintain basic physiological functions at rest.


3) [19/04, 7:06 am] Dr. Avinash Kumar Gupta: Cgpt


The estimation of calories burned during activities like walking involves several scientific methods and studies. The calorie expenditure for an activity like walking is typically determined through experiments that measure energy output in controlled settings. Here’s a brief outline of how scientists might arrive at such data:


1. **Metabolic Measurements**: One common method to determine calories burned is through direct and indirect calorimetry. Direct calorimetry measures the amount of heat the body emits, but it’s complex and not widely used. Indirect calorimetry is more common and measures oxygen consumption and carbon dioxide production. Since the body needs oxygen to burn nutrients for energy, and produces carbon dioxide as a byproduct, measuring these gases can give a reliable estimate of energy expenditure.


2. **Using Metabolic Equivalents (METs)**: The concept of METs (Metabolic Equivalents) is often used. One MET is defined as the energy it takes to sit quietly, equivalent to a calorie expenditure of 1 kcal/kg/hour. Physical activities are assigned MET values based on how much harder your body works relative to sitting quietly. For example, walking at a mild pace (about 3-4 mph) typically has a MET value of around 3.0 to 4.5 METs.


3. **Calculations Based on METs**:

   - First, the MET value is multiplied by the person’s body weight in kilograms.

   - Then, this number is multiplied by the duration of the activity in hours to find the total caloric expenditure.


   For instance, if walking at a mild pace has a MET value of 3.5, an 80 kg person walking for 1 km (which they might complete in about 10-15 minutes, or about 0.2 hours), the calculation would be:

   \[

   \text{Calories burned} = 3.5 \text{ METs} \times 80 \text{ kg} \times 0.2 \text{ hours} = 56 \text{ kcal}

   \]

   (Note: This is just an example; actual values might vary based on the specific speed and individual metabolism).


4. **Field Studies and Adjustments**: Scientists also conduct field studies where they monitor real-life activities rather than controlled laboratory settings. They might use portable devices that track physiological responses like heart rate, breathing rates, and even sweat rates to estimate energy expenditure more accurately in day-to-day activities.


5. **Calibration and Validation**: Any method used to calculate or estimate caloric expenditure is usually calibrated against more established methods (like those using laboratory equipment) and validated in different populations to ensure accuracy across age, body weight, and fitness levels.


When it comes to the provided data — an 80 kg person burning 80 calories walking 1 km — this might be a slightly simplified or rounded figure used for easy calculation. In actuality, the calories burned can be influenced by factors like walking speed, terrain, efficiency of movement, and individual metabolic differences. The figure could be derived from an average or estimated value that broadly fits the profile and activity described.

[19/04, 7:28 am] Dr. Avinash Kumar Gupta: "Definition

A MET is defined as the resting metabolic rate, that

is, the amount of oxygen consumed at rest, sitting quiet-

ly in a chair, approximately 3.5 ml 02/kg/min (1.2

kcallmin for a 70-kg person).* As such, work at 2 METS

requires twice the resting metabolism or 7.0 ml O,/kg/min

and three METS requires three times the resting

metabolism (10.5 ml 02/kg/min), and so on"


29 m quantified self pajr -2


Energy expenditure 


Weigh loss trend
2 may - 80.5 kg


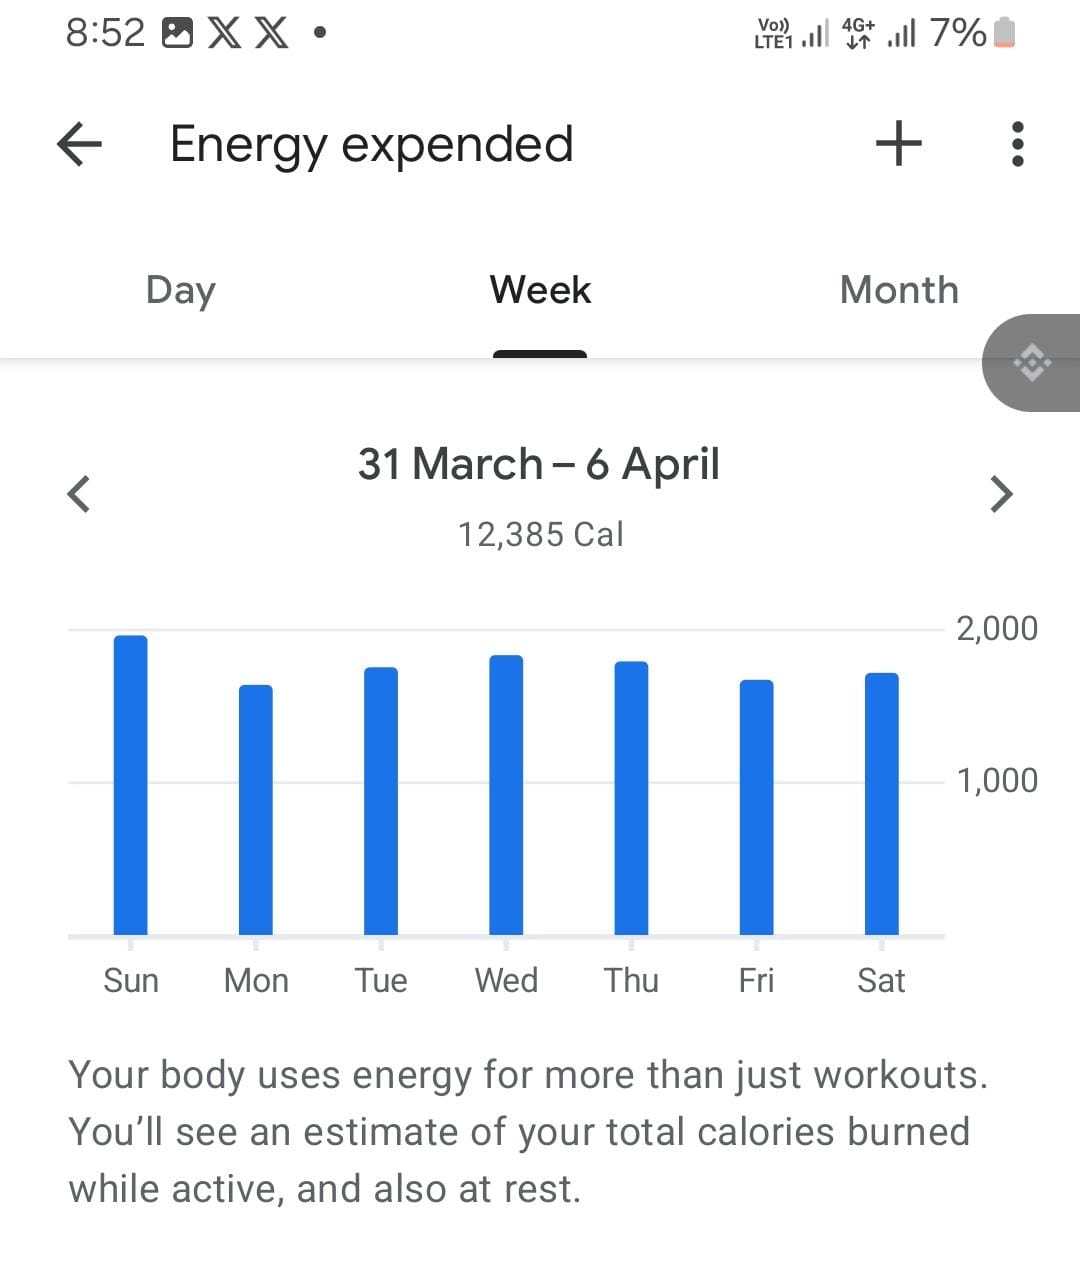
Average energy expenditure daily by calculation (differs alot from values in Google fit)

BMR for 82kg weight, 29M = 1800

Calorie burnt in moderate speed walk is equal to weight of person for each km. So 80kcal per km.

Average daily walk - 7km

Average daily expenditure in walk = 560kcal

Average daily calorie expenditure = 2360kcal


Calorie intake data till 2 may from 7 April.

2 may - 1300 kcal
1 may - 1800 kcal
30 apr - 1600 kcal
29 apr - 1040 kcal
28 apr - 2300 kcal 
27 apr - 950 kcal
26 apr - 1530 kcal
25 apr - 1280 kcal
24 apr - 1500 kcal
23 apr - 1400 kcal
22 apr - 2075 kcal
21 apr - 1200 kcal
20 - 
19 apr - 1200 kcal
18 apr - 1150 kcal
17 apr - 1500 kcal
16 apr - 1400 kcal
15 apr - 1500 kcal
14 apr - 1425 kcal
13 apr - 1250 kcal
12 apr - 700 kcal
11 apr - 1450 kcal
10 apr - 1400 kcal 
9 apr - 1200 kcal
8 apr - 1620 kcal 
7 apr - 1600 kcal


Pics of a few meals


Example of calorie counting on a day

Breakfast 
- litti (4) - 240 kcal

Lunch
- chhachh - 50 kcal
- tea with sugar - 50 kcal

Evening
- Lassi - 350 kcal
- mango Pana - 100 kcal

Night
- curd - 250 kcal

Total 
   - Calorie intake = 1040 kcal
  - walk = 8 km
  - calorie expense = 2520 kcal (google fit shows 2140 kcal)
  - calorie deficit = 1480 kcal.


Graph of calorie, spent and intake. From 7 April to 2 may. Spent Average is take as 2360, orange is intake and blue showing is deficit.


Height 5.5

Weight 80.5 from 87

BMI -  29.5 to 32

Abdominal girth - 102 from 112 cm

Waist circumference - 100 from 106 cm

MAMC 33 cm


Sunday, 7 April 2024

29M quantified self PaJR

PaJR = patient journey record where patient advocate share a patient's updates according to guidance they get from their primary care provider who is supported by a group of volunteer medical professionals (ranging from medical innovators who may be engineers and  medical students, to residents and consultants. Basically a knowledge network). [Currently Implemented as a whatsapp group]

The patient advocate ensures privacy, data management, and continuity of care.

The updates are:

- lifestyle modification related eg. Calorie deficit

- medication adherence related,

- patient education queries,

etc.


The current case is a 29 year old otherwise healthy but obese man having weight of 86.5-87 kg even after being physically active. His height is 5 feet 5 inches, BMI is 32 and below is picture from Google fit (mobile) data about his daily walk (since many months his average is 5km daily).


All the analytics and charting below is done with help of ChatGPT (free version) and google collab (to run python code output given by chat gpt).


Estimated Basal Metabolic Rate (BMR) for this 29-year-old obese man is approximately 1877.22 kcal/day. 


For 1 month of calorie deficit (31 days)  patient maintained average daily total walk of 5km. Checked weight nearly every week - 86.5, 85, 84, 83, 82.5.


These are his daily calorie intake for 31 days. (Calorie counting done manually by patient advocate. )


1. 600 kcal

2. 750 kcal

3. 1200 kcal

4. 1000 kcal

5. 1100 kcal

6. 800 kcal

7. 900 kcal

8. 1700 kcal

9. 1300 kcal

10. 1400 kcal

11. 2000 kcal

12. 1500 kcal

13. 1250 kcal

14. 1500 kcal

15. 1800 kcal

16. 1450 kcal

17. 1150 kcal

18. 1400 kcal

19. 1450 kcal

20. 1500 kcal

21. 1800 kcal

22. 1500 kcal

23. 1400 kcal

24. 1300 kcal

25. 1200 kcal

26. 1250 kcal

27. 1700 kcal

28. 1900 kcal

29. 1150 kcal

30. 1000 kcal

31. 1350 kcal


Patient used to take around 2500 kcal daily before starting intervention. 


Here are some useful graphs. (The data is in reverse order in these graph 1, 2, & 4).


ChatGPT - One fascinating insight from this reverse order calorie counting data is the oscillation between higher and lower calorie days. By visualizing this data as a sine wave graph, with each day represented as a point along the curve, we see a rhythmic pattern emerge. The peaks and troughs represent days of higher and lower calorie intake respectively, creating a visually stunning wave pattern that illustrates the natural ebb and flow of dietary habits. This visualization highlights the balance between indulgence and restraint, offering a captivating depiction of the intricate dance of calorie consumption over time.


In simple words

- trend is useful to see it started Aggressive and plateau at around 1500 kcal
- seasonal indicate that after getting more strict patient is going back to less strict by variation of around -200 to +200 kcal range.

(Dates are incorrect in this graph).


This data also helps to predict calorie intake for next day it may have high inaccuracy. Regression analysis predicted next day calorie intake to be 1561 kcal.


Useful motivating / behavioural nudging messages are also possible which may also have good information to help reduce junk food intake by awareness. Like -

Day 1 - 600 calories intake: Equivalent to approximately 0.7 liters of petrol or 1.3 servings of chowmein.


Day 31 - Calorie deficit: 2500 - 1350 = 1150 calories

1) Equivalent to approximately 10,000 steps of brisk walking.

2) Equivalent to 45 minutes of high-intensity interval training (HIIT).


Requesting to share if any inputs/corrections in comment section below this blog post.

You may also like to check my precious work about fever charts here - https://classworkdecjan.blogspot.com/2021/02/some-tech-for-just-fever-sign.html