Why - because these fever charts (and many more charts) are easily available everywhere and once digitized this will help to collect a huge amount of data and explore it for medical and AI research. So starting small with fever charts to explore the possibility.
Collaborating with friends having an engineering background, because just medical school itself is tough to manage for me so can't get hands dirty nowadays on coding (I like python). Names of collaborators and links to project updates will be updated here later.
A sample fever chart -

This is how I started doing it manually and made a tutorial in the hope that other medicos and patients can also do it after following the steps
http://classworkdecjan.blogspot.com/2017/08/using-fever-chart.html


It was tiring to do manually so I could not manage to do frequently.
I tried the above sample image with google OCR (vision API) and here are the screenshots


A simpler way could be that just in table form write date time and temp. and a chart generated automagically by OCR, but let see how far this idea goes for using the real world available and regularly generated paper records.
Problem statement shared with engineering folks - generate a graph from this image. without manual inputs. if better handwriting, or legends or anything can improve then humans may try that, but best if the algorithm does more work and less expectation from the human. it's ok to make a very inefficient project, we can improve. only need the legend values + graph + date. (rest all data can be ignored for now)
Solutions:
1- one easy hack can be, writing temp. values as legends on graphs.
comments are welcome!
Collaborating with friends having an engineering background, because just medical school itself is tough to manage for me so can't get hands dirty nowadays on coding (I like python). Names of collaborators and links to project updates will be updated here later.
A sample fever chart -
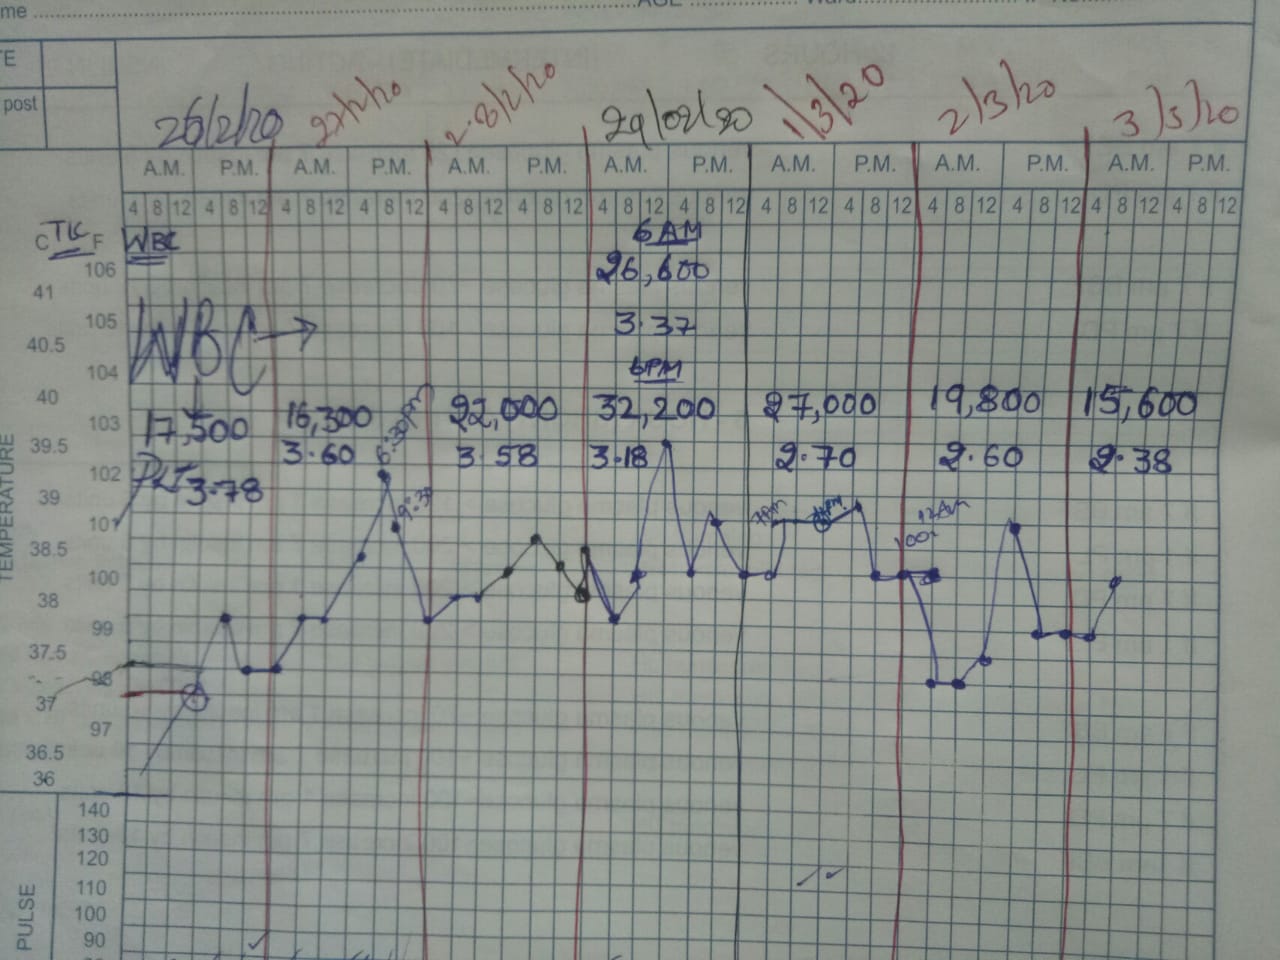
This is how I started doing it manually and made a tutorial in the hope that other medicos and patients can also do it after following the steps
http://classworkdecjan.blogspot.com/2017/08/using-fever-chart.html


It was tiring to do manually so I could not manage to do frequently.
I tried the above sample image with google OCR (vision API) and here are the screenshots


A simpler way could be that just in table form write date time and temp. and a chart generated automagically by OCR, but let see how far this idea goes for using the real world available and regularly generated paper records.
Problem statement shared with engineering folks - generate a graph from this image. without manual inputs. if better handwriting, or legends or anything can improve then humans may try that, but best if the algorithm does more work and less expectation from the human. it's ok to make a very inefficient project, we can improve. only need the legend values + graph + date. (rest all data can be ignored for now)
Solutions:
1- one easy hack can be, writing temp. values as legends on graphs.
comments are welcome!


